Swimmers spend their lives training to improve their performance. Coaches rightly focus on improving “PBs” (personal best times) rather than winning races. It’s therefore crucial that swimming timekeepers are accurate.
The standard measure of a swimming time is to 1/100th of a second. For most events human timekeepers pressing a button are either the primary or backup source of times. We investigated their accuracy and have been fascinated by our findings.
Remember that Precision and Accuracy are different!
My school Physics teacher was very particular about the difference between precision and accuracy! Precision is represented by the number of digits in a number, whereas accuracy is closeness to the correct value.
Just because a value is precise does not mean that it is accurate! Consider many public transport timetables that are precise but often not accurate.
A typical timing system
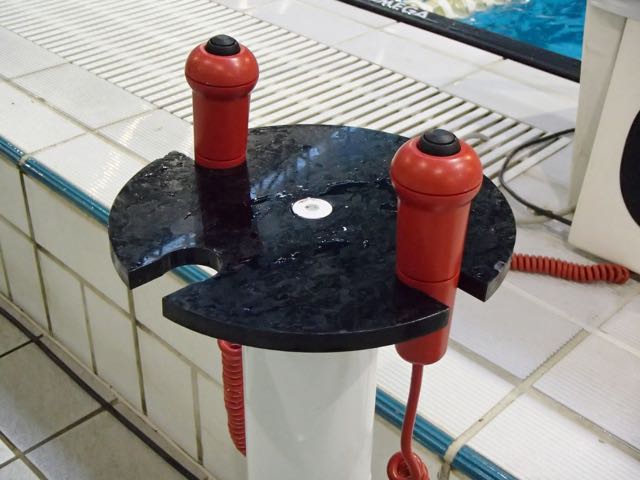
Large venues are often equipped with a timing system that uses both touch pads and backup buttons (eg: Quantum). Touch pads are activated by swimmers completing their race, and are generally the source of the official time for that swimmer.
Touch pads use electro-mechanical technology, a little like a traditional electric front door bell. They can sometimes become unreliable or sluggish with age or lack of maintenance. Smaller swimmers sometimes fail to apply sufficient pressure to trigger them.
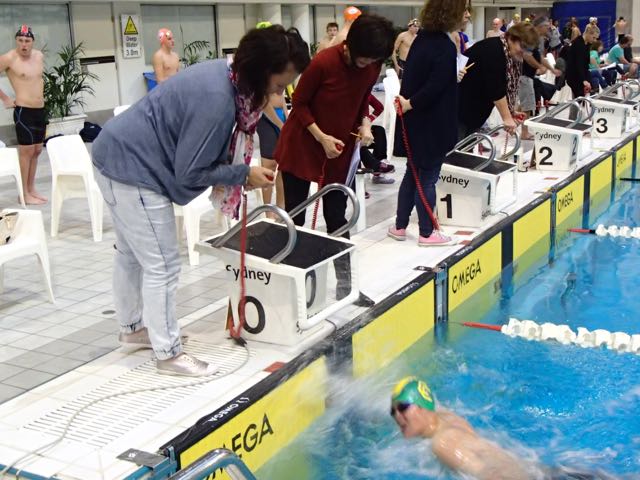
Backup human timekeepers are therefore used alongside touch pads to ensure that all swimmers are properly timed. Ideally there are 3 backup timekeepers per lane, often there are 2 and sometimes only 1.
These timekeepers are usually volunteers and are asked to press a button when any part of a swimmer’s body touches the wall at the end of a race. Timekeepers are instructed to look down the wall at the end of the race, rather than watching the inbound swimmer approach, because this generates more accurate times.
We observed 737 swims
We attended a swim meet at a venue running the equipment described above on 5th January 2022. There were 2 backup timekeepers per lane. These timekeepers were volunteer parents who changed with others periodically during the day. It is not known how many of them were instructed in correct operation.
All 10 lanes of the pool were in operation and these were numbered 0 to 9. The pool was 50m in Long Course configuration.
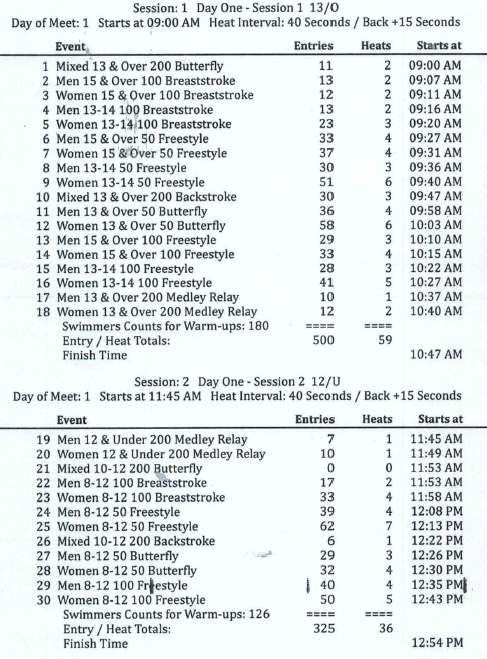
The swim meet was for swimmers aged 8 years and older racing a range of strokes with distances between 50m and 200m. The schedule is shown in Table 1 below.
Session 1 of the meet commenced at 8:59am and concluded 11:06am. Session 2 commenced at 11:46am and concluded shortly before 1pm.
Every touch pad and backup timekeeper button press was captured for every race. All 737 swims were captured during the day.
The official time for each swimmer was determined by the Referee. In most cases this was the touchpad time, unless the Referee decided that the pad had failed. In that case the average of the 2 backup timekeeper times, truncated to 2 decimal places, was used.
We compared the timekeepers with the touch pads
We deemed the official time to be the accurate result. We then compared the backup timekeeper times against the official time, for each swim.
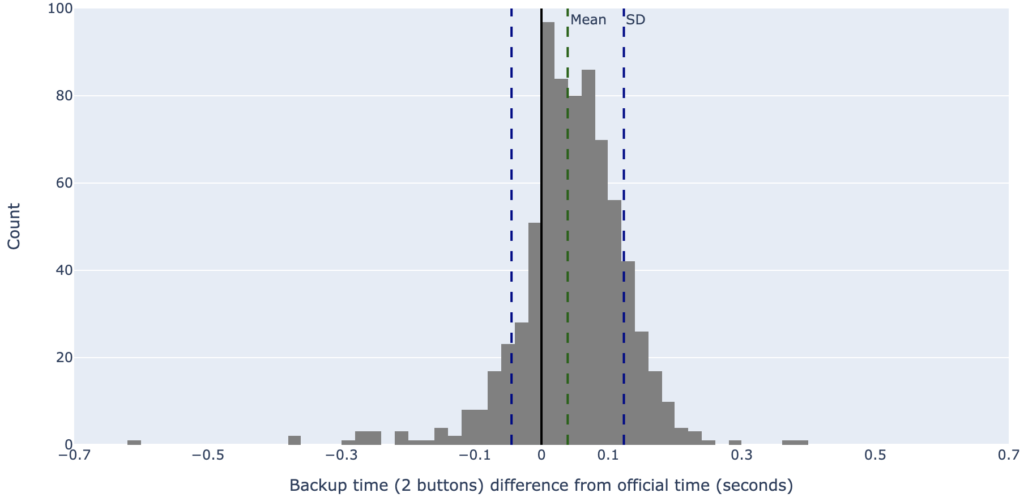
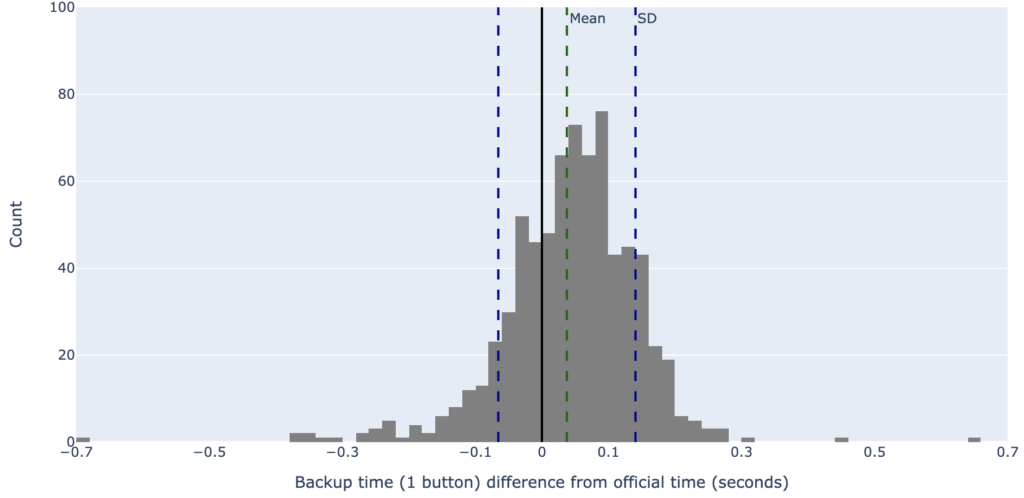
The difference between the backup time and the official time was calculated for each swim and plotted on a frequency distribution chart. We also added mean and standard deviation markers. See Figure 1 below.
Mean: 0.03s Standard Deviation: 0.08s
Positive differences (to the right of 0) are for backup times slower than the official time. Negative differences (to the left) are for backup times faster than the official times.
This shows that the mean backup time is 0.03s slower than the official time. We believe that this is due to the human reaction time between seeing a touch and pressing the button.
The spread is arguably more significant because this is the distribution of times that a swimmer actually gets. Aside from a few clear outliers, the spread of times in Figure 1 roughly varies between -0.3s and +0.3s. Statistical theory says that in distributions approximating to normal, c.95% of all occurrences are placed within 2 standard deviations of the mean. Hence 95% of all backup times are within -0.12s and +0.20s of the official times.
This 1/3rd of a second spread (0.32s), although small, is not insignificant in the context of times quoted to 0.01s.
The above is based on 2 timekeepers per lane. 3 are preferred because it increases accuracy. These were not available for our experiment. We therefore chose to evaluate the reduction in accuracy where only 1 backup timekeeper per lane was used.
One timekeeper is 23% worse than two
We used the same data set, evaluating only the time from button 1. In a few cases there were no times recorded for button 1 so we selected button 2 for that lane swim. See results in Figure 2 below which is plotted on the same scale as Figure 1.
Mean: 0.03s Standard Deviation: 0.10s
The mean backup time remains at 0.03s slower which is not a surprise because there is no reason to expect that one timekeeper is less accurate than two on average. The difference is the wider spread which can be seen visually as a shorter and broader distribution.
The standard deviation has increased which means that 95% of all backup times are within -0.16s and +0.24s of the official time.
In summary the spread of times has increased by 23% by reducing the number of backup timekeepers from 2 to 1.
A touchpad failed for 1 in 20 swims
Earlier we mentioned that touchpads are not completely reliable. The Referee may decide to use a backup time in case of touchpad failure. During this event the Referee did this for 35 / 737 = 4.7% of lane swims (approximately 1 in 20).
Note that in our above analysis we did not remove these cases. This will have artificially increased the calculated accuracy of backup timekeepers. Due to the limited number of occurrences this we expect this will have limited impact on the results.
As we dig deeper into the data below, this issue will become more significant.
Accuracy and touchpad reliability varies by stroke
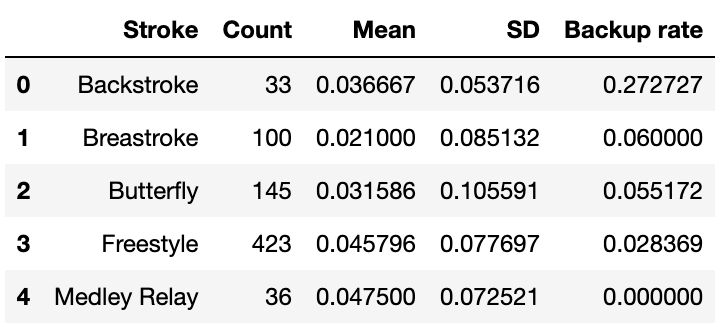
We segmented the above analysis by stroke (using 2 backup timekeepers). Numerical results are shown in Table 2 below.
We need to be extremely cautious about competing results by stroke because the data sample sizes are so different (eg Freestyle has 423 lane swims vs 33 for backstroke). Further, the cohort of swimmers and/or event distance is not necessarily equal for each stroke. Nevertheless we have compared for interest purposes.
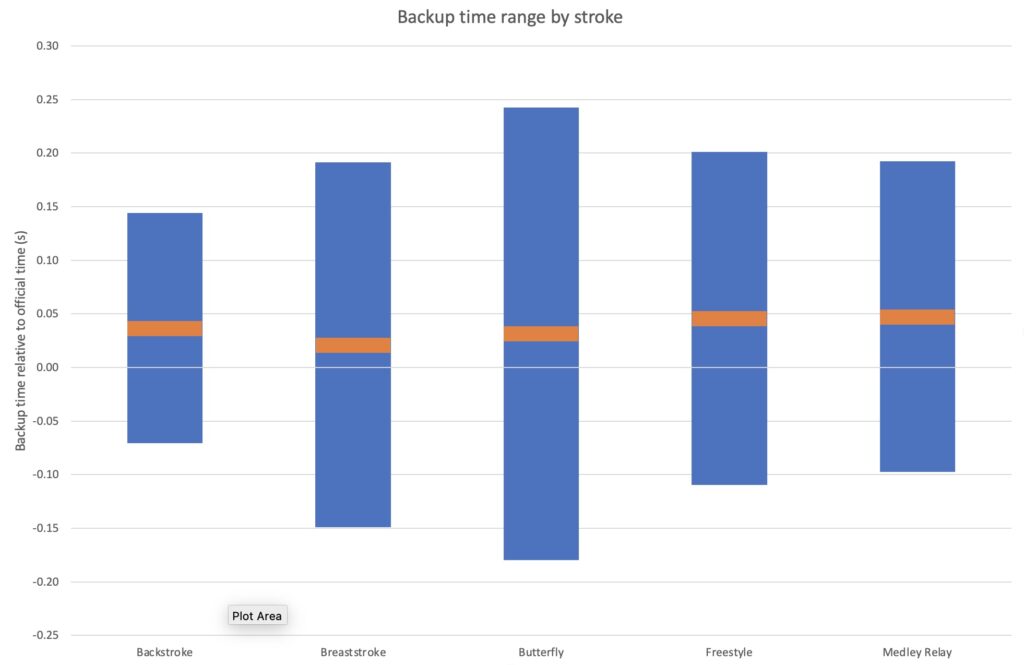
To simplify the accuracy data, we have plotted each stroke as a 2 standard deviation range (blue) around the mean (orange). See Figure 3 below.
Interesting observations:
- Backstroke is an outlier. Touchpad failure rate (Backup Rate) is 27% vs 4.7% for all lane swims. This probably accounts for the smaller looking accuracy range. The sample size for backstroke is small and only 200m events were included so exercise extreme caution in drawing conclusions.
- Butterfly has the broadest accuracy rate. We presume that is this because the splash size at the end of butterfly races makes it more difficult for timekeepers to determine when the swimmer touches the wall.
- Breaststroke: mean is half that of freestyle, but the standard deviation is greater. We have no explanation.
- Freestyle touchpad reliability is highest. This may be because of the way swimmers finish freestyle events, although the high number of fast and powerful 50m events may bias the result.
Accuracy varies by time of day
Numerical results of segmenting by hour bands during the day are shown below in Table 3.
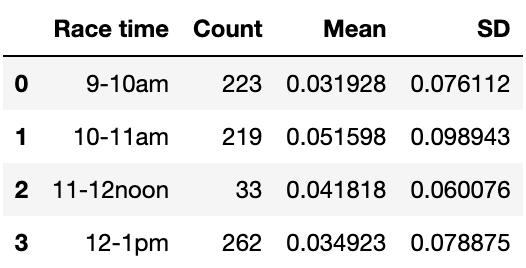
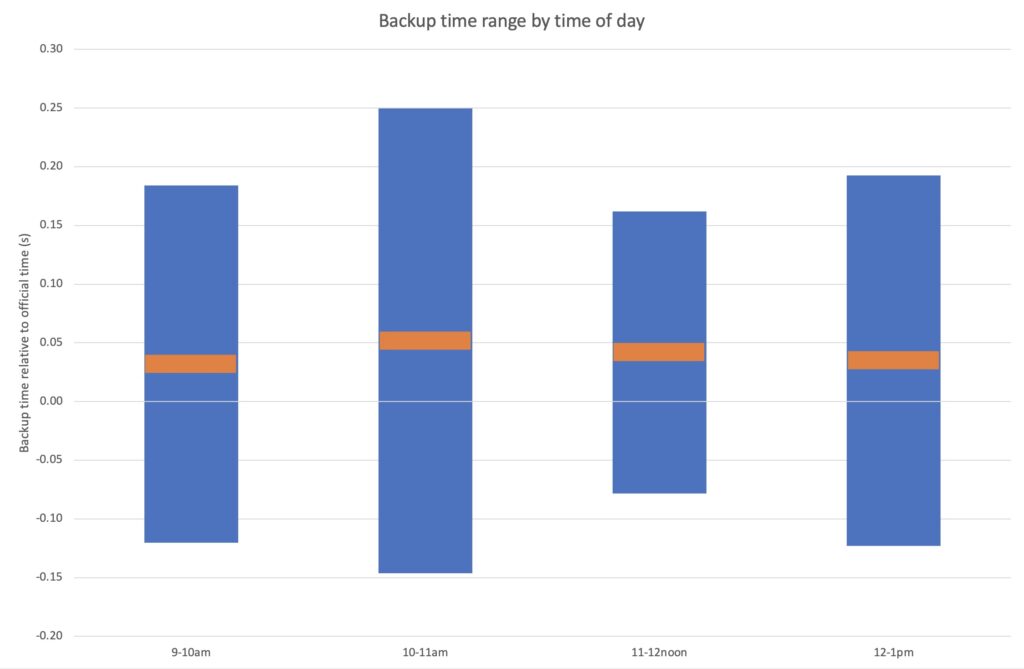
Graphical results are shown in Figure 4 below.
Note there was a break from 11:06 to 11:46am.
Again, we need to be cautious about conclusions because the mix of events differed in each hour, the scheduling of timekeeper rotations was not known, and the 11am – 12noon hour has a small sample size. We presume there were fresh timekeepers at the start of each session which would explain the observation that their performance declined over time thereafter.
Accuracy and touch pad reliability varies by lane
Numerical results of segmenting by lane are shown in Table 4 below.
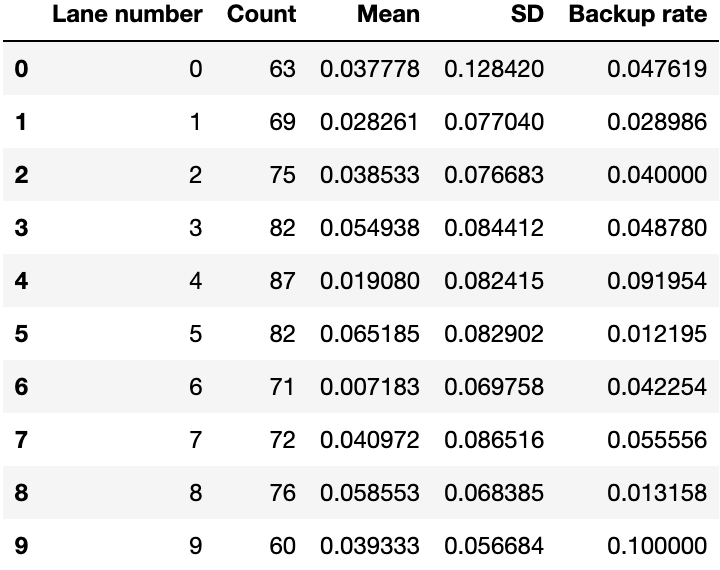
Due to the significant variations in touchpad failure (Backup rate) between lanes, to eliminate this as a variable we ignored the times where backups were used. These results are shown in Table 5 below.
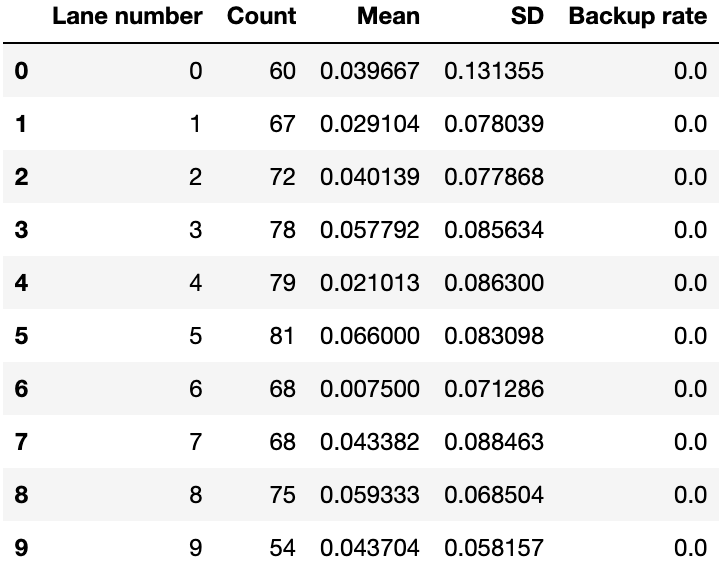
Graphical results of Table 5 data are shown in Figure 5 below.
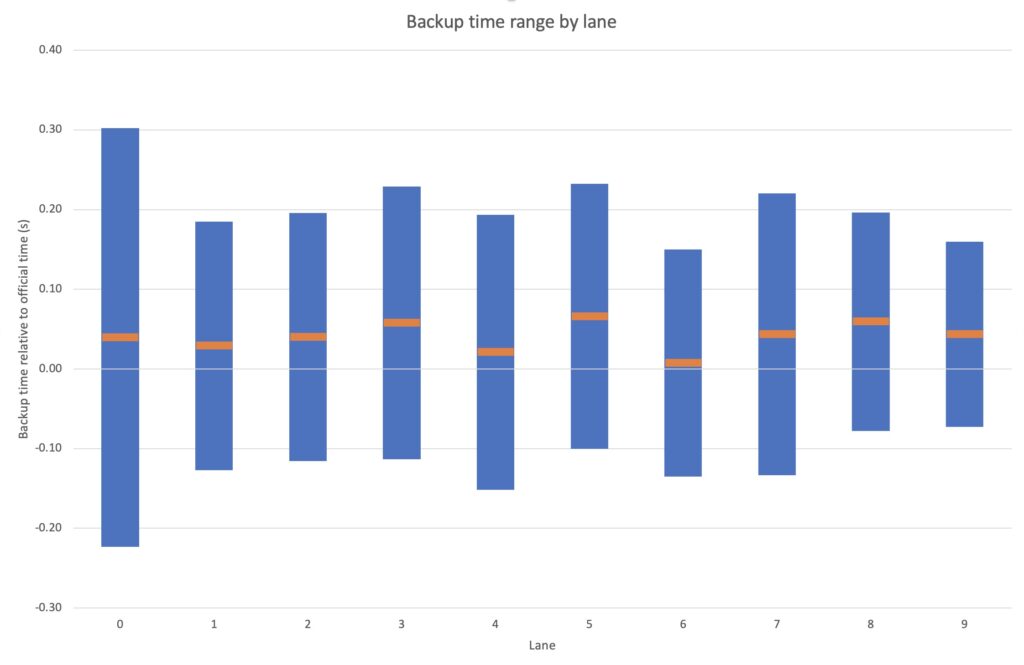
The variation by lane is significant because each lane has the same cohort of events. Middle lanes have a slightly larger sample size than the outside lanes. Differences in results can therefore be attributed to human or equipment reasons.
Observations:
- Touchpad failure rates vary enormously between lanes. The highest is 10% (lane 9) vs lowest 1.2% (lane 5).
- Mean variation is significant – compare lanes 5 and 6 which we can only attribute to differences between the timekeeping teams.
- Lane 0 range is an outlier. We assume that this is due to 1 or 2 particularly unreliable timekeeper(s).
Swimmer gender does not affect accuracy
Numerical results of segmenting by gender are shown in Table 6 below.

The sample sizes are are different (there were 40% more female swims than male during the event). We believe that there are no significant variations between gender which is not a surprise.
50m vs 100m race distance does not affect accuracy
Numerical results segmented by race distance are shown in Table 7 below.
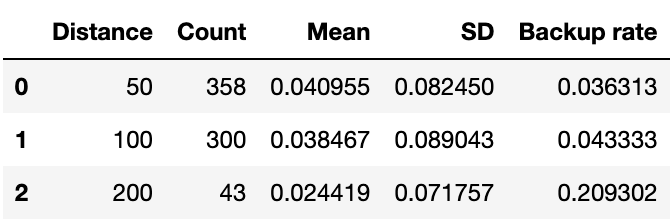
We have discounted the 200m events because they are both a small sample size and dominated by the backstroke events that are known to be an outlier. The accuracy for 50m and 100m events are very close.
Age of swimmer impact on accuracy is unclear
Numerical results segmented by age group of swimmer are shown in Table 8 below.
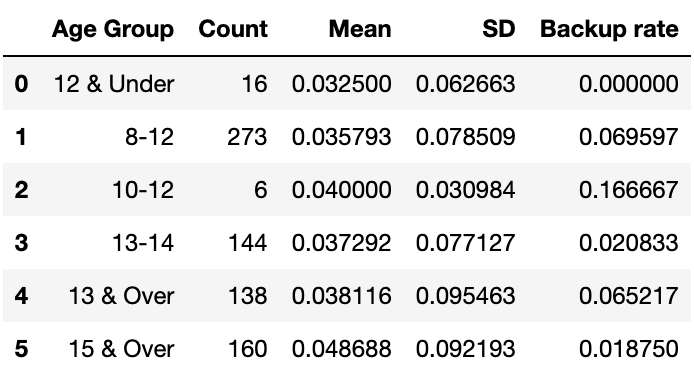
The ’12&U’ and ’10-12′ age groups have been discounted due to the tiny sample sizes. It is difficult to pick any trends from the remaining data. In particular, the difference in touch pad failure rate between ’13&O’ (6.5%) and ’15&O’ (1.9%) is difficult to understand.
So what does all this mean?
It is tempting to be concerned about all the various variations here. For developing swimmers in low stakes events that would be a mistake.
We have identified a spread of times of 0.32s (with 2 timekeepers per lane) and 0.40s (with 1). In the context of developing swimmers who are likely continually improving and not particularly consistent in their performance, this seems reasonable.
Results to 1/100th of a second are more precise than they are accurate
That said, this variation is sufficiently large that measuring times to 1/100th of a second appears to be invalid. Results are more precise than they are accurate.
For elite swimmers and high stakes events, where times, placings and records can be separated by 1/100th of a second, 2 timekeepers per lane is inadequate.
For this reason, for significant records, and judging places in close races, relying on 2 timekeepers per lane does not seem appropriate.
These conclusions do not affect the rules of swimming
The rules of swimming do have minor variations between jurisdictions. In most cases they anticipate touch pads and 3 backup timekeepers per lane or backup high speed video timing. Where these requirements are not available, records may not stand and/or finish judges may be required. We have not investigated the accuracy of 3 backup timekeepers.
Timekeepers are doing a great job!
Expert officials reviewing this paper have commented “the data shows that the time keeping is within the guidelines especially when you consider the tolerance for reaction time and finishes”. Apparently the data is very similar to that collected in the past based on accredited timekeepers. This suggests that there is no appreciable difference in accuracy between accredited and non-accredited timekeepers.
Ben Ramsden
email: hello [at] swim.rocks
Credits
- Swimming Metro North East for allowing us to use data from their Summer Championships. Note this data has been de-identified of all club and swimmer names.
- Peter Shell, Cherry Smith and Chris Hayes for expert assistance.
- Lucinda Davies for data analysis.
Note this post was first published on the Swim.Rocks website.

